Project 5: Spatial estimation of Arid Plant distribution clusters
- As a proxy for vegetation photosynthetic activity, vegetation indices (VIs) were estimated from the visible to near-infrared, i.e. VIS-NIR, spectral bands from remote sensing images.
- Sentinel-2 Level-2A (S-2A) images we collected using the Google Earth Engine (GEE) cloud computing platform. For this, we considered scenes within the period from January to December 2021 without cloud filtering. The clouds were later masked and the images co-registered as image collections.
- In an exploratory analysis of vegetation cover, 5 different vegetation indices (VIs) were computed and stacked for processing and analysis.
- As no ground truth data was available for the period of exploratory analysis (2021), we applied an unsupervised image classification procedure was applied.
- This classification experiment hypothesised that a combination of VIs will provide complementary information and features to enhance thresholding of vegetation and land cover types. Nonetheless, for VI-based classification, it is inappropriate to assume similar vegetation class thresholds for all VI types - the widely applied thresholds may not be optimal for all VIs, vegetation types and context.
- The K-means clustering algorithm was applied with 5 clusters selected based on visual observations from the classes obtained by VI thresholding.
- On this basis clustering results, we applied five thresholds of potential vegetation classes (< 0.2: No Vegetation, 0.2 – 0.3: Low vegetation, 0.3 – 0.4: Sparse vegetation, 0.4 – 0.5: Moderate vegetation, and > 0.5: Moderate-High vegetation).
- Image thresholding procedure and unsupervised classification (image clustering) were conducted using the GEE cloud computing platform and the resultant images exported as Geo Tiff files for further (supervised) analysis.
K-Means Clustering Silhoutte Metric
Heirarchical Cluster Analysis Dendrogram
Jaccard Similarity Index Analysis of Clusters
Vegetation cover classes for Wadi Ashar according to thresholds of different vegetation indices (VIs):
a. NDVI b. EVI, c. SAVI, d. MSAVI, and e. GSAVI
The vegetation classes from unsupervised (K-means clustering) classification of time-series images of 5
VIs
-
For supervised classification, available Sentine-2 (S-2) images covering the study areas were accessed using the Google Earth Engine (GEE) cloud computing platform, and the time-series images were filtered for images acquired for the area of interest in the period between 1st January 2021 to 15th September 2022 with cloudy pixel percentage of < 5% for each image.
-
A total of 85 images (temporal series) were accessed following this filtering criteria, and each image collection was processed to compute 5 different vegetation indices (VIs) that provide proxy for vegetation status and cover.
-
In addition to spatial information from VIs, we explored information lurking in the spectral signatures (for both vegetation and non-vegetation) to potentially improve the classification based on VIs.
-
A total of 20 spectral bands (4 from each VI corresponding to the Blue, Green, Red, and Near Infrared bands) were subjected to a Principal Component Analysis (PCA), as data reduction procedure, to obtain a set of uncorrelated spatial features. Based on the PCA, 5 Principal Components (PCs) explained about 99% of the variance in the spectral signatures for the study area.
-
Thus, in total, 10 raster layers (5 PCs and 5 VIs) were used as the spatial predictors or environmental space for vegetation classification
-
The reference polygons for the vegetation assemblages or land cover classes were used to extract training data from the stack of raster layers (10 explanatory or predictor rasters). Considering disparities in both the number and size of reference polygons for each class, the extracted training data or pixels were unbalanced across the considered classes
-
To map the vegetation assemblages (and land cover) using a supervised analysis, the random forest classification algorithm was implemented to delineate clusters of vegetation types, hitherto identified using hierachical cluster analysis (HCA), and grouped as clusters of plant assemblages.
-
For supervised classification, Random Forest classification models were trained to learn distinguishing features of plant assemblages based on the ten (10) raster predictors.
-
Considering an unbalanced tally of reference clusters and extracted spatial data between the target vegetation and land cover classes, we tuned the hyper-parameters for the random forest classification algorithm by applying a spatial cross-validation procedure (Meyer et al., 2018).
-
A spatial 5-fold cross-validation (k = 5) was implemented, as the ground truth data had the minimum of 5 reference polygons for the “Bare rock” class. Thus, ensuring each fold in cross-validation contains data from each reference class.
-
Based on the unique IDs for each reference polygon, a spatial cross-validation with the Leave-Location-Out Cross-Validation (LLO-CV) algorithm was implemented. This ensured that data from the same polygon are always grouped to prevent usage in both model training and testing (Meyer et al., 2018) by leaving the location (ID) out at each iteration of model training.
Class Uncertainty Distribution
Predicting Area of Applicability (AOA) of Classifier model
Distribution of Vegetation cover and Plant Assemblages based on Random Forest (Ensemble) classification
and Spatial cross-Validation
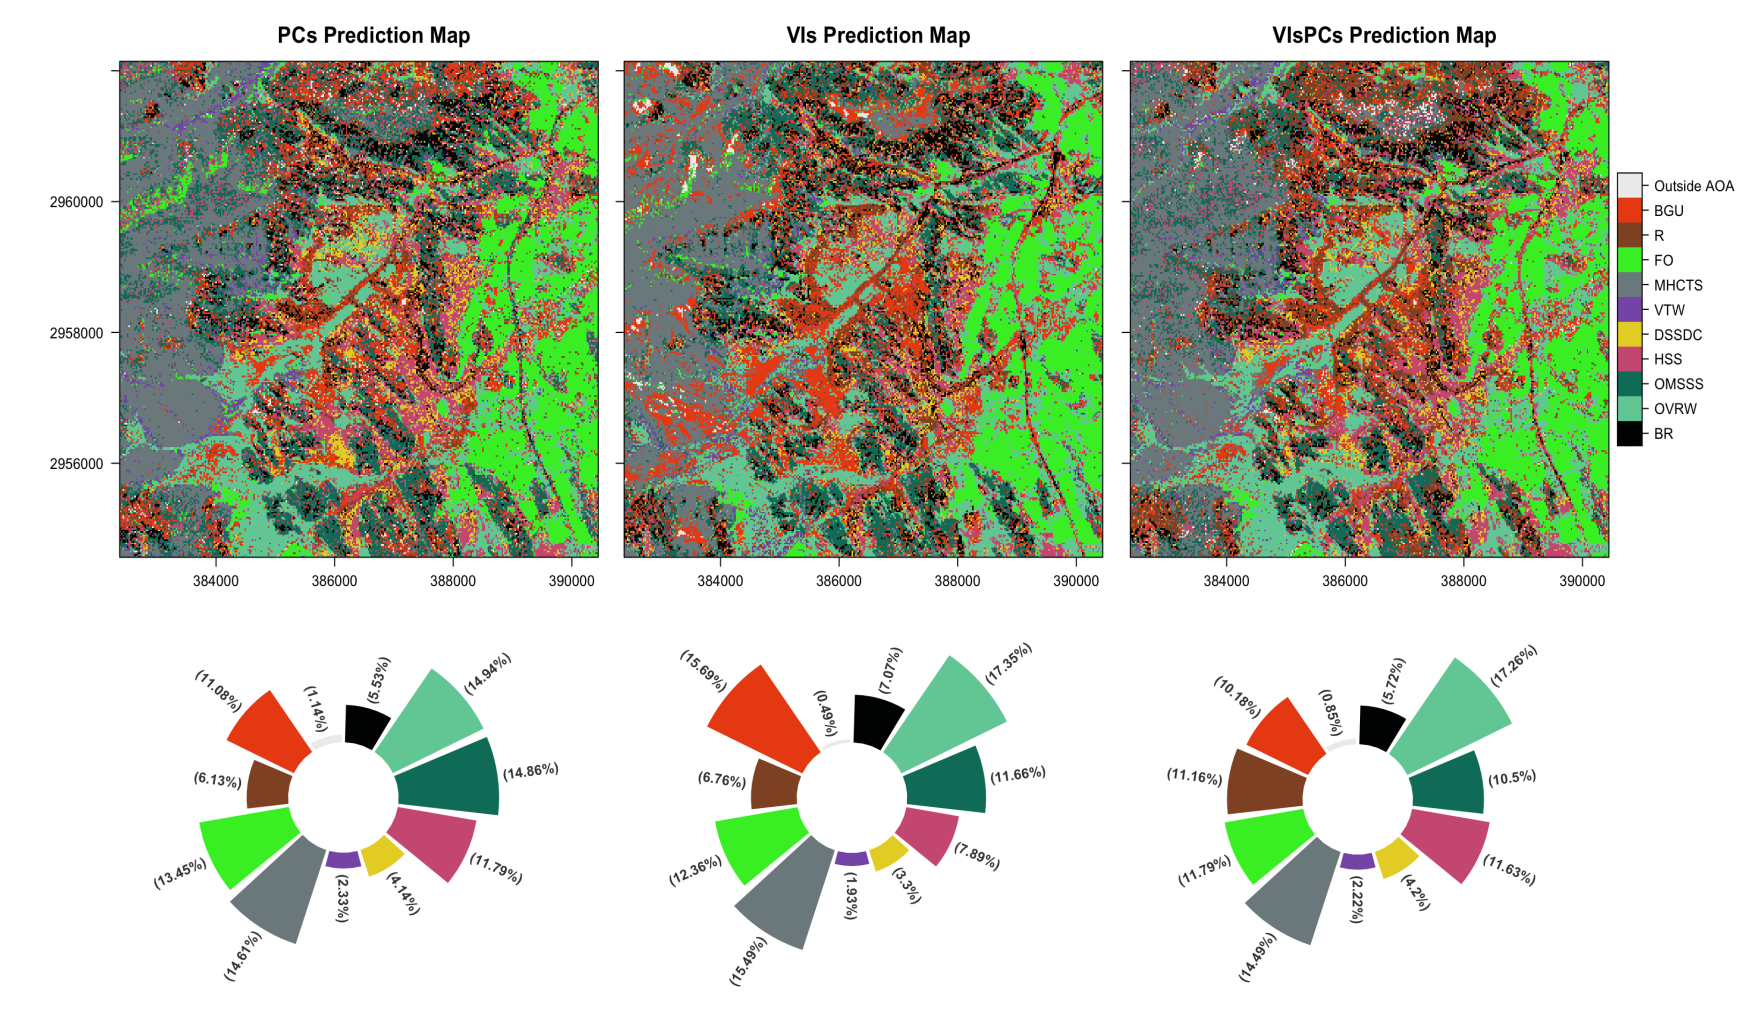
Class predictions from different classifier models
Meyer, H., Reudenbach, C., Hengl, T., Katurji, M., Nauss, T., 2018. Improving performance of spatio-temporal machine learning models using forward feature selection and target-oriented validation. Environ. Model. Softw. 101, 1–9. https://doi.org/10.1016/j.envsoft.2017.12.001