Project 4: Forest (and Tree) Cover Loss from 2001-2021 in Cashew production landscapes
-
An analysis of trends in Tree and Forest Cover change in cashew production (the project) areas covering three agro-ecological zones.
-
Ivory Coast (CDI) is ranked second global producer of cashew nuts, behind India. In CDI, cashew production contributes an important proportion (1.3%) of national GDP (FAO 2018) and to the livelihood of an important number of small-scale farmers.
-
However, increasing production of cashew is strongly tied to increases in the production land (Figure 1). Cashew production is carried out in about 19 (of the 33) regions in CDI (Bassett et. al. 2018) and predominantly in the Sudan and Sudano-Guinean agro-ecological zones (FAO 2018), which are largely characterised as fragile ecosystems.
-
Notwithstanding the exponential increase in cashew nut production and export, cashew yield in CDI has remained consistently low in the past 3 decades (Figure 2). Thus, changes in climate and weather patterns, besides other farming and land use (tenure) challenges, may inflict important impacts on cashew yield in such production zones.
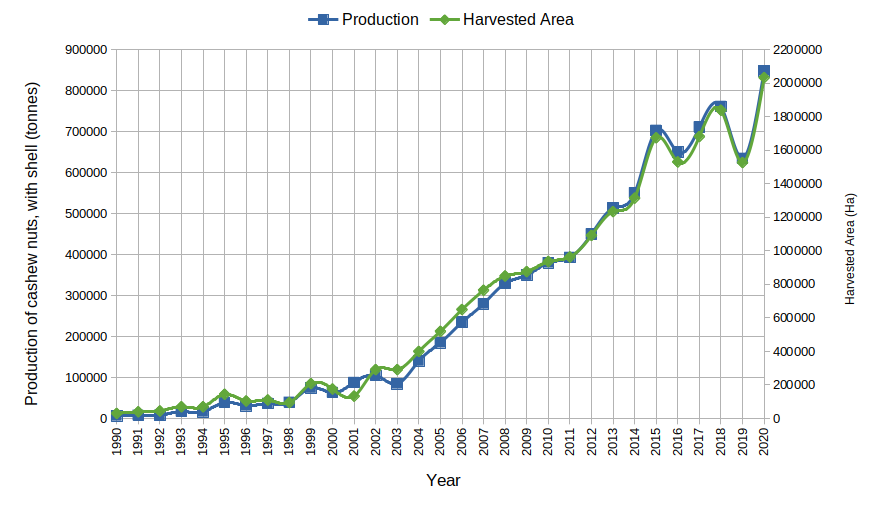
Figure 1. Cashew production and harvested area in Ivory Coast over last 3 decades (Data source: Faostats
accessed on 6 March 2022)
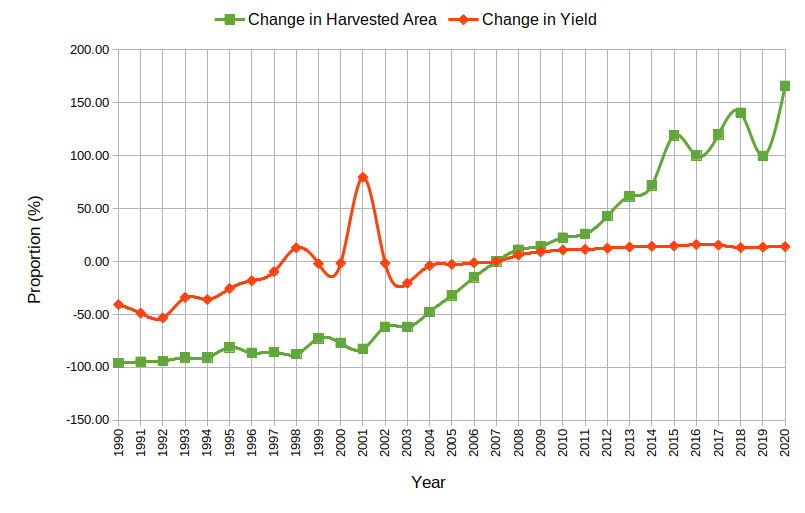
Figure 2. Changes in cashew harvested area and yield compared to values of a reference year of 2007 -
when Ivory Coast signed up to the Kyoto Protocol (Data source: Faostats accessed on 6 March 2022)
-
Using the reference data (map) on tree cover in 2000 and yearly gross tree cover loss maps (Hansen et. al. 2013), we computed trends in forest loss over a 2-decade period.
-
Currently, there is no global consensus on the definition of forest cover and extent. Depending on the country and forest types, the definition and estimates of forest cover extent is based on different values of minimum crown cover (%), minimum area (ha), and minimum width (m).
-
In this project and analysis, we employ the Food and Agricultural Organization (FAO) standards and definition of forest cover in quantifying forest cover and loss: tree crown cover ⩾ 10%, area ⩾ 0.5ha, and width ⩾ 20m.
-
Forest loss area is estimated using a wall-to-wall 30m resolution forest cover loss map and contiguous area ⩾ 0.53ha.
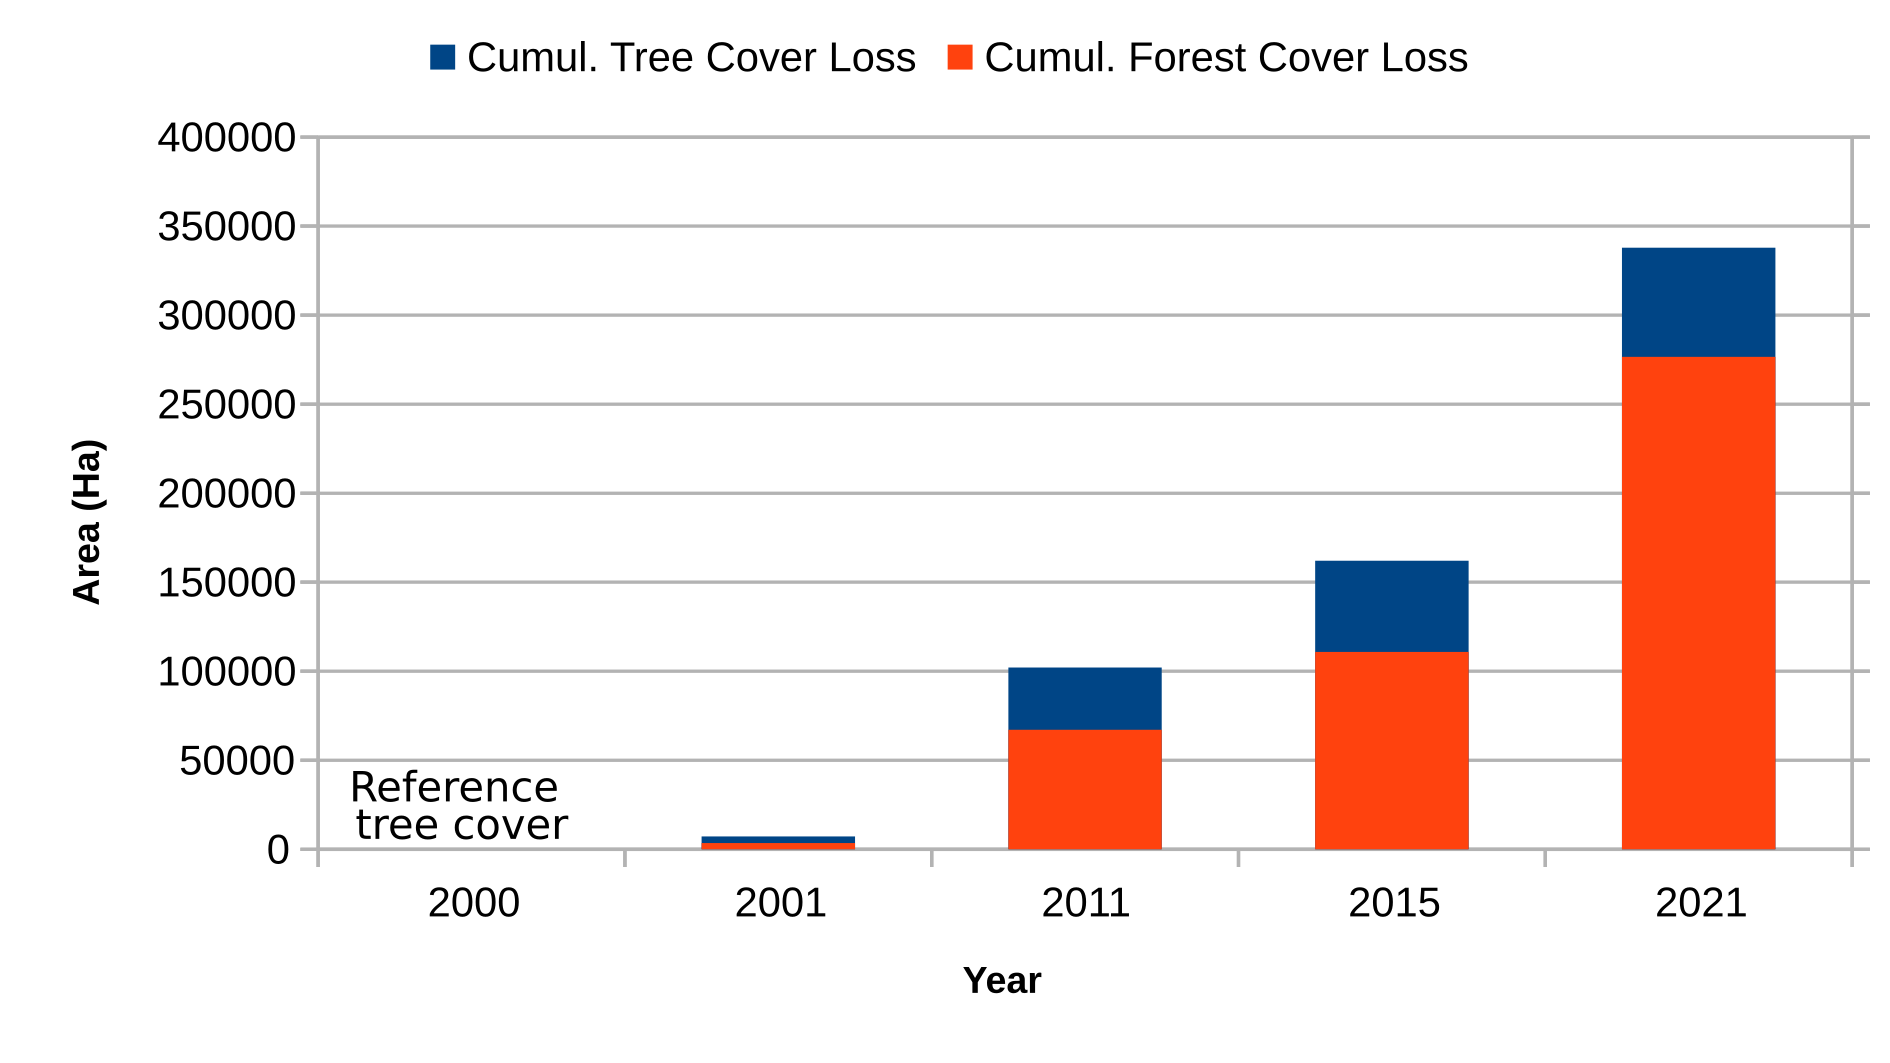
Cumulative proportions of Forest and Tree Loss over 2 decades (2000-2021)
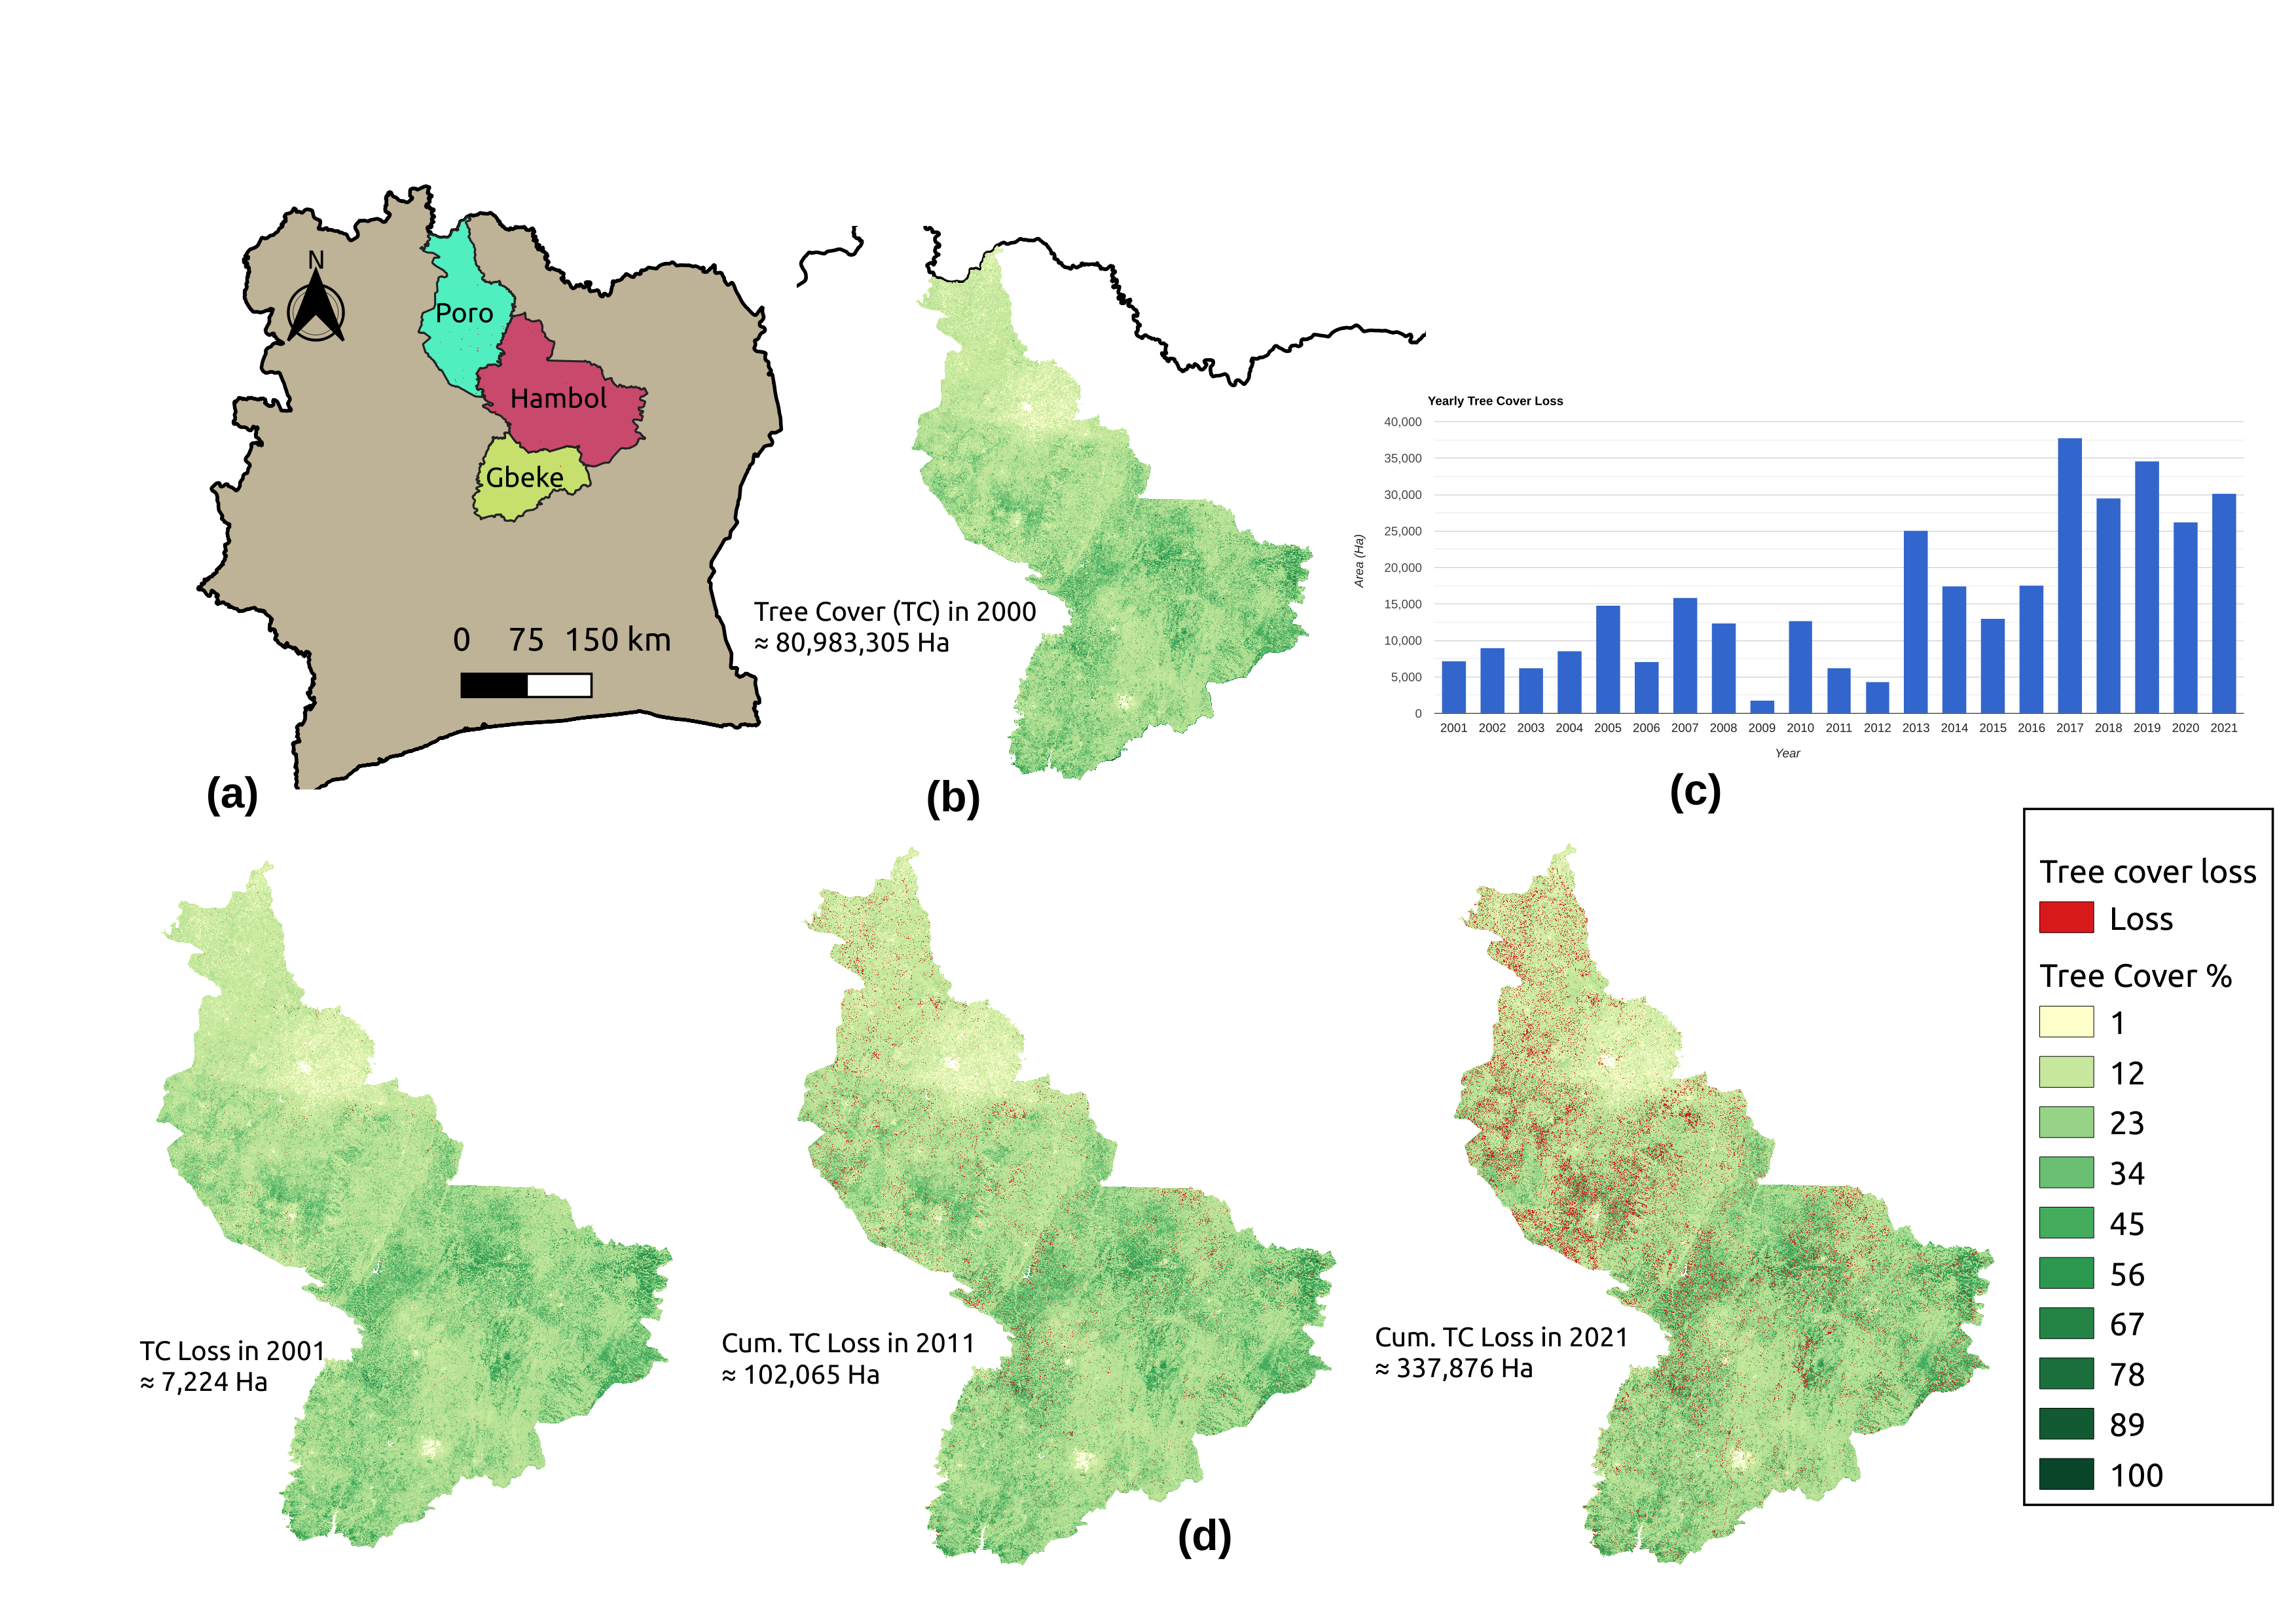
Temporal changes in tree cover and loss in the project area over the last two decades: (a) Overview of
project location at regional scale; (b) Reference tree cover in 2000 based on the Global Forest Cover
Dataset; and (c) Yearly change in tree cover from 2001 to 2021; and (d) Estimates of cumulative tree cover
loss across in the last two decades.
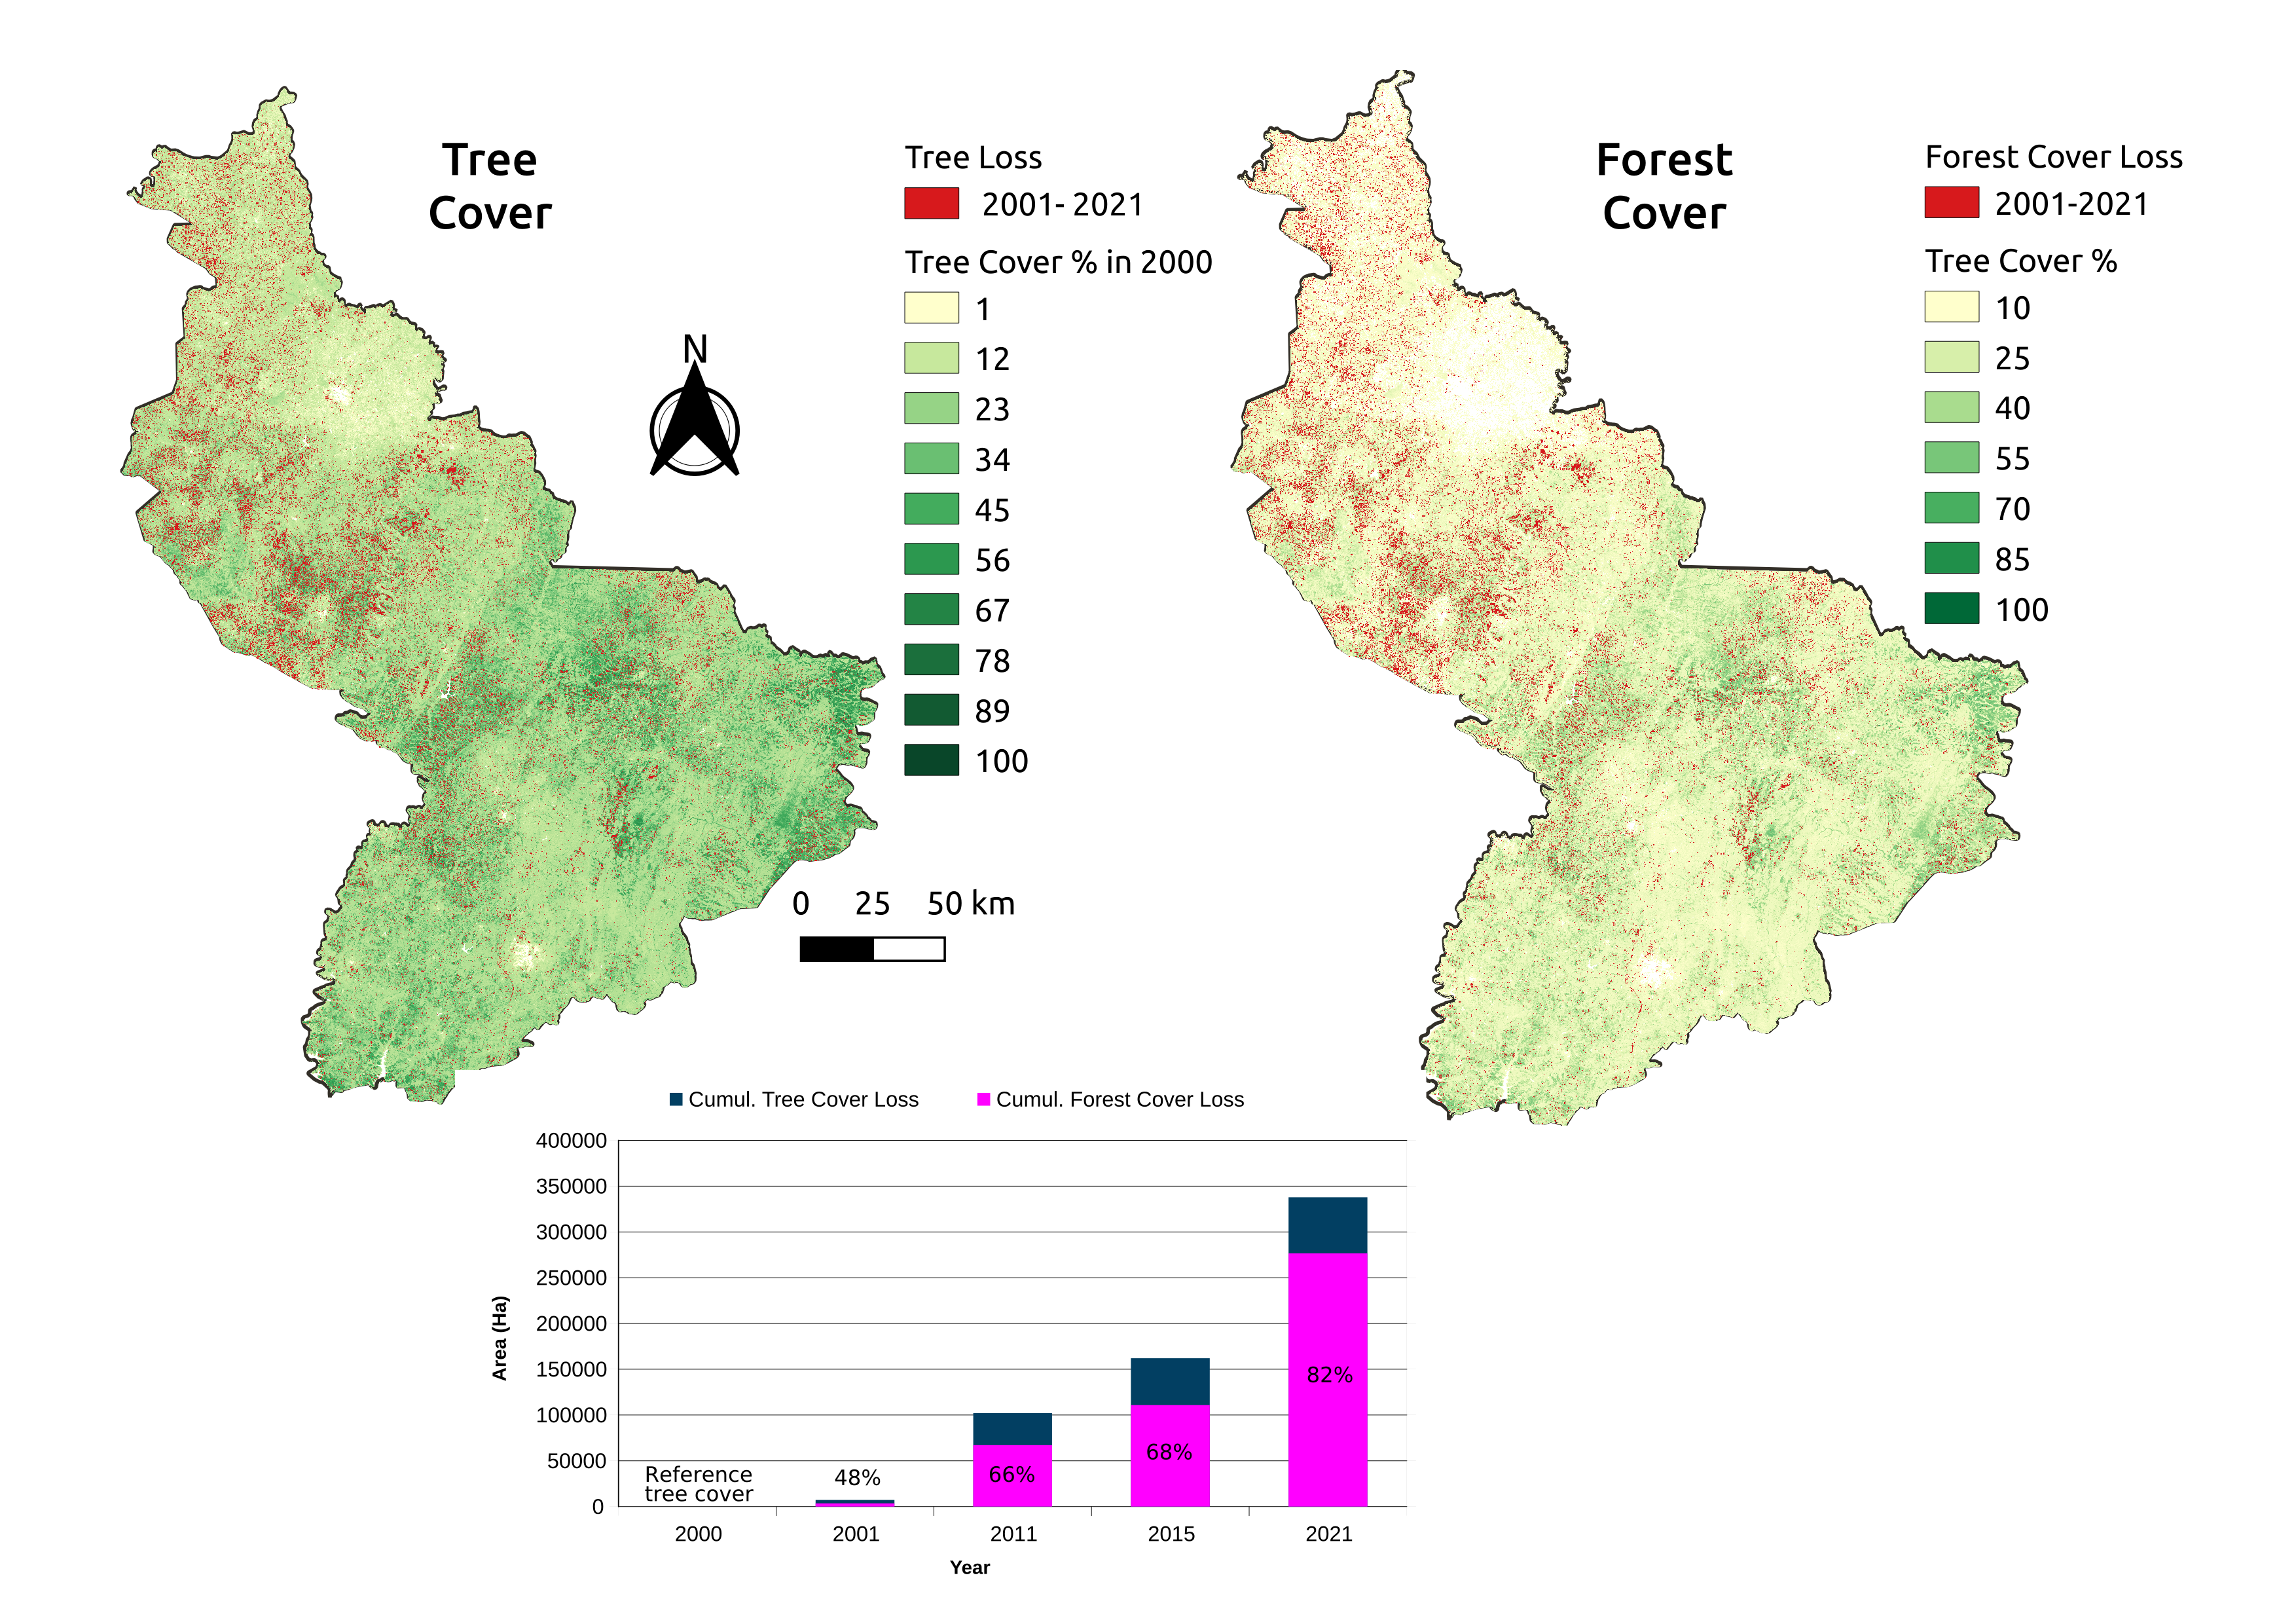
Illustrative Maps and estimates of tree cover and forest cover loss in the project area. For the
cumulative tree cover loss in each year, the estimated proportion (%) of forest cover is highlighted.
FAO; ICRISAT; CIAT. 2018. Climate-Smart Agriculture in Côte d’Ivoire. CSA Country Profiles for Africa Series. International Center for Tropical Agriculture (CIAT); International Crops Research Institute for the Semi-Arid Tropics (ICRISAT); Food and Agriculture Organization of the United Nations (FAO). Rome, Italy. 23p.
Bassett T. J., Kone M., Pavlovic N. R. (2018) Power Relations and Upgrading in the Cashew ValueChain of Cˆote d’Ivoire. Development and Change 49(5): 1223–1247. DOI: 10.1111/dech.12400.
Grüter R., Trachsel T., Laube P., Jaisli I. (2022) Expected global suitability of coffee, cashew and avocado due to climate change. PLoS ONE 17(1): e0261976. https://doi.org/10.1371/journal.pone.0261976
Hansen, M. C., P. V. Potapov, R. Moore, M. Hancher, S. A. Turubanova, A. Tyukavina, D. Thau, S. V. Stehman, S. J. Goetz, T. R. Loveland, A. Kommareddy, A. Egorov, L. Chini, C. O. Justice, and J. R. G. Townshend. 2013. “High-Resolution Global Maps of 21st-Century Forest Cover Change.” Science 342 (15 November): 850–53.